Analytical Paragraphs
Beginning 2020, CBSE has included 'Analytical Paragraph' as one of the writing tasks in the Writing
Section of the Question Paper. It will be based on some data or information given in a map, chart, report, graph or diagram etc.In writing such a piece, students will be expected to critically analyse the given information and then summarize or describe it in a creative but objective manner; suggest a solution to a problem it may present; arrive at and describe a logical decision; apply the information to draw conclusions or make suggestions or find out and present alternative ways of doing something in order to save time, energy, resources, funds etc.
Clearly, it is not going to be an easy task for most students to manage, but it will not be impossible either, if it is done in pairs or groups with plenty of scaffolding and good samples from teachers. It is needless to say that an answer to a question requiring an analytical paragraph as output cannot and must not be memorised.
Instead, students must develop the necessary skills for writing such paragraphs.
So, what skills are needed for writing effective analytical paragraphs?
Alison Doyle in her article: "What Are Analytical Skills? – Definition and Examples of Analytical Skills" (posted on the website
https://www.thebalancecareers.com/)
lists the following 21st century analytical skills –not in the same order –that are necessary for employees.
These skills are equally important for and relevant to school and college
Students, too:
1.Research
2.Communication
3.Data analysis/
4.Critical Thinking
5.Creativity
6.interpretation
According to Alison, when a learner is trying to detect patterns, brainstorm ideas, observe facts, interpret data, draw conclusions, suggest 'out-of-the-box' or 'not so obvious' solutions to problems, he/she is using the above mentioned analytical skills.Whether attempted individually or in pairs or groups, an analytical paragraph will require students to first develop these skills and then employ them dextrously to produce paragraphs that are well structured, lucid and logical as well as meet the length criterion.
An analytical paragraph should have the following structure:
A. Topic Sentence which is an opening statement or introduction that briefly describes what the paragraph is about.
B. Body that forms the detailed description, summary, interpret
ation or explanation of the information or data in the given input.
C. Conclusion which can be a logical deduction, a decision or a suggestion. It may also be a warning or a caution, too.
Compacta recommends that the out-put of a question on' analytical paragraph's
hould be only on e physical paragraph of about 150 words.
If CBSE specifies that the output may be of more than one paragraph, the single paragraph may be divided into two or three short paragraphs . that follow the structure of an article.
Some Useful Expressions for Writing an Analytical P aragraph
1. HOW TO REPORT AN INCREASE
A. Has risen/increased/gone up/shot up…
B. Has experienced/seen a rise/an increase in…
C. Has shown/registered a rise/an increase…
D. Has reached a maximum/a peak of…
HOW TO SHOW A DECREASE
A. Has fallen/gone down/come down to…
B. Has dropped from......… to .......…
C. Has experienced/registered/shown a fall/a decrease/a decline in….
D. Has hit/touched/reached its lowest/minimum level/point...
HOW TO REPORT DIFFERENCES
A. Is better than/more than double/half as much/three times more/less than....
B. Not as big as/as much as/as large as...
C. Many times over/more/less...
HOW TO REPORT SIMILARITY
A. Is the same as/similar to...
B. Is/Are comparable with...
C. Can be grouped together/classified together/clubbed with...
D. Show(s) similarity/similarities...
E. There are striking similarities between...
HOW TO REPORT Comparisons AND CONTRASTS
A. As compared to…
B. In (sharp) contrast to/with…
C. Is comparable/not comparable with…
D. Compares well with.../Contrasts with…
HOW TO REPORT Constancy OR NO CHANGE
A. Has seen/registered/experienced/shown no change...
B. Has remained constant/unchanged/the same...
Example:
01
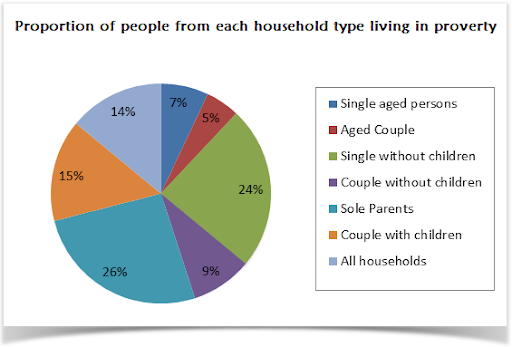
The pie chart shows the proportion of people from different households living in poverty in the UK in 2002. Write an analytical paragraph to describe the information in 100-120 words.
Answer:
The given pie chart illustrates seven different categories of households living in poverty in the UK in 2002.
It is clearly evident from the pie chart that 26% of the total poverty-stricken households are those of sole parents. Single people without children account for the second highest proportion with 24%. In contrast to couples without children that accounts for just 9%, couples with children account for 15% of the poor households. Single aged persons and aged couples proportion for 12% together for poor households.
Overall, 14% of all households in the UK were living under poverty. The younger generation had a greater poor percentage than their aged counterparts. Couples without children had better economic conditions than those with children.
The given pie chart represents the amount of money spent by a family on different items in a month. Write an analytical paragraph using the information given in the chart.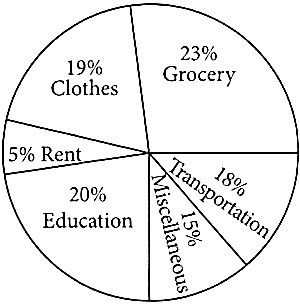
Answer: The pie chart provides information about the amount of money a family has spent on different items in a month. On an average, the family has spent majorly on grocery which is twenty-three percent of the total expenses. Whereas it has spent 20 percent on education which shows that it’s the second priority for the family.
Overall the data shows that they have not spent much on the unnecessary items or miscellaneous. After spending on grocery which is of utmost importance they have spent a significant amount on education. The least money is spent on miscellaneous items after spending on their rent which is their liability. Thus, it is evident that 85% of their total amount of money was spent on their liabilities whereas only 15 percent was spent on other items that might not be necessary to spend on.

Comments
Post a Comment